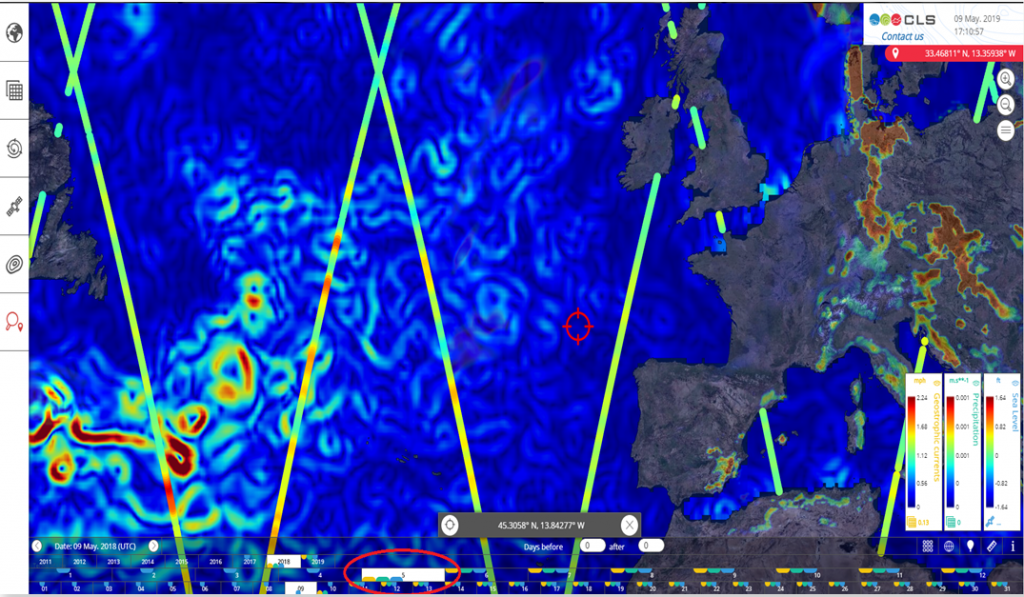
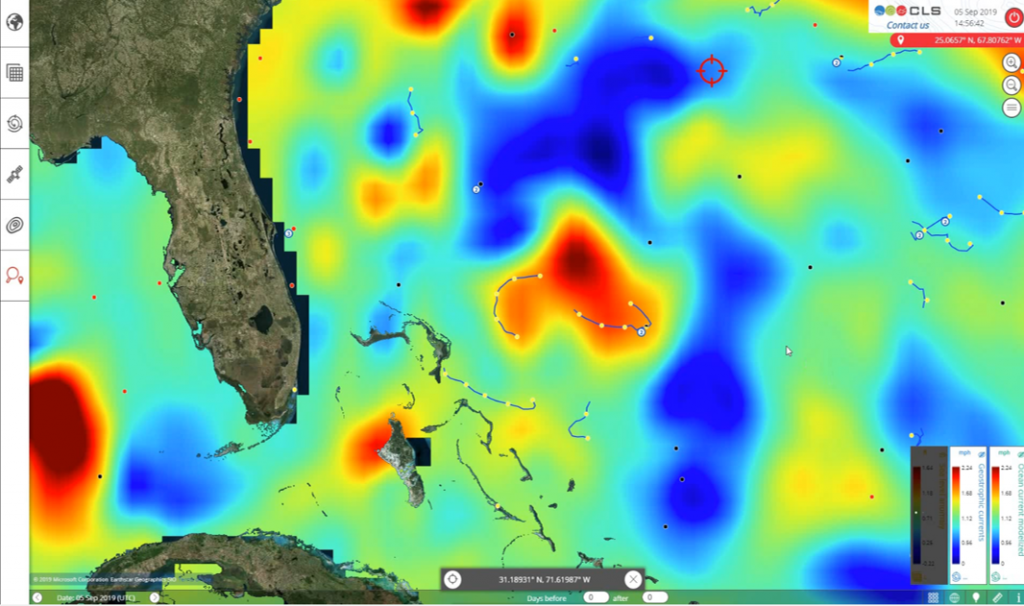
SEEWATER is a state-of-the-art web portal to display and download daily, fine-scale information about the physical ocean – capitalizing on CLS oceanographic expertise.
SEEWATER provides a single entry point for ocean and weather data accessible via open data websites (Copernicus Marine Service, Climate Change Service, etc) and provides an intuitive, easy-to-use interface for displaying in-situ data with satellite observations of the physical ocean.

Why use SEEWATER?

Display and download
a large catalogue of data

Use SEEWATER to visualize
meteorological, oceanographic
and continental water data

NetCdf CF data can be added
to allow interactive visualization
of 2D and 1D data
Create and download your own graphs or datasets
- SEEWATER allows time series extraction of each displayed layer
- SEEWATER allows the extraction of a data subset with a selection on geospatial and temporal dimensions to download only the area of interest

Simple and intuitive time coverage selection
Viewing simultaneous multiple layers implies that the user can easily figure out the temporal coverage of each layer. The time coverage selection is possible through a time line, years, months and days (temporal coverage available can exceed 30 years).
View in-situ data
Select platform types and parameters to view. Users choose between a number of options including Virtual station, Moring, Argo, Drifter, Depths, Salinity, …. SEEWATER is a key tool making it possible to view and download in situ data trajectories with contextual environmental data. Users can correlate trajectories with a number of visualized data layers.


